


Regardless of the company – or the industry – senior managers in manufacturing enterprises need to make decisions based on cold, hard, irrefutable facts. They need numbers. They need data. They need to ensure that their decision to move forward has a high probability of success.
Senior managers need this critical information to make a go/no-go decision on capital expenditures, hiring, expansion, machine and equipment repairs, or, more aptly, for pursuing continuous improvement projects.
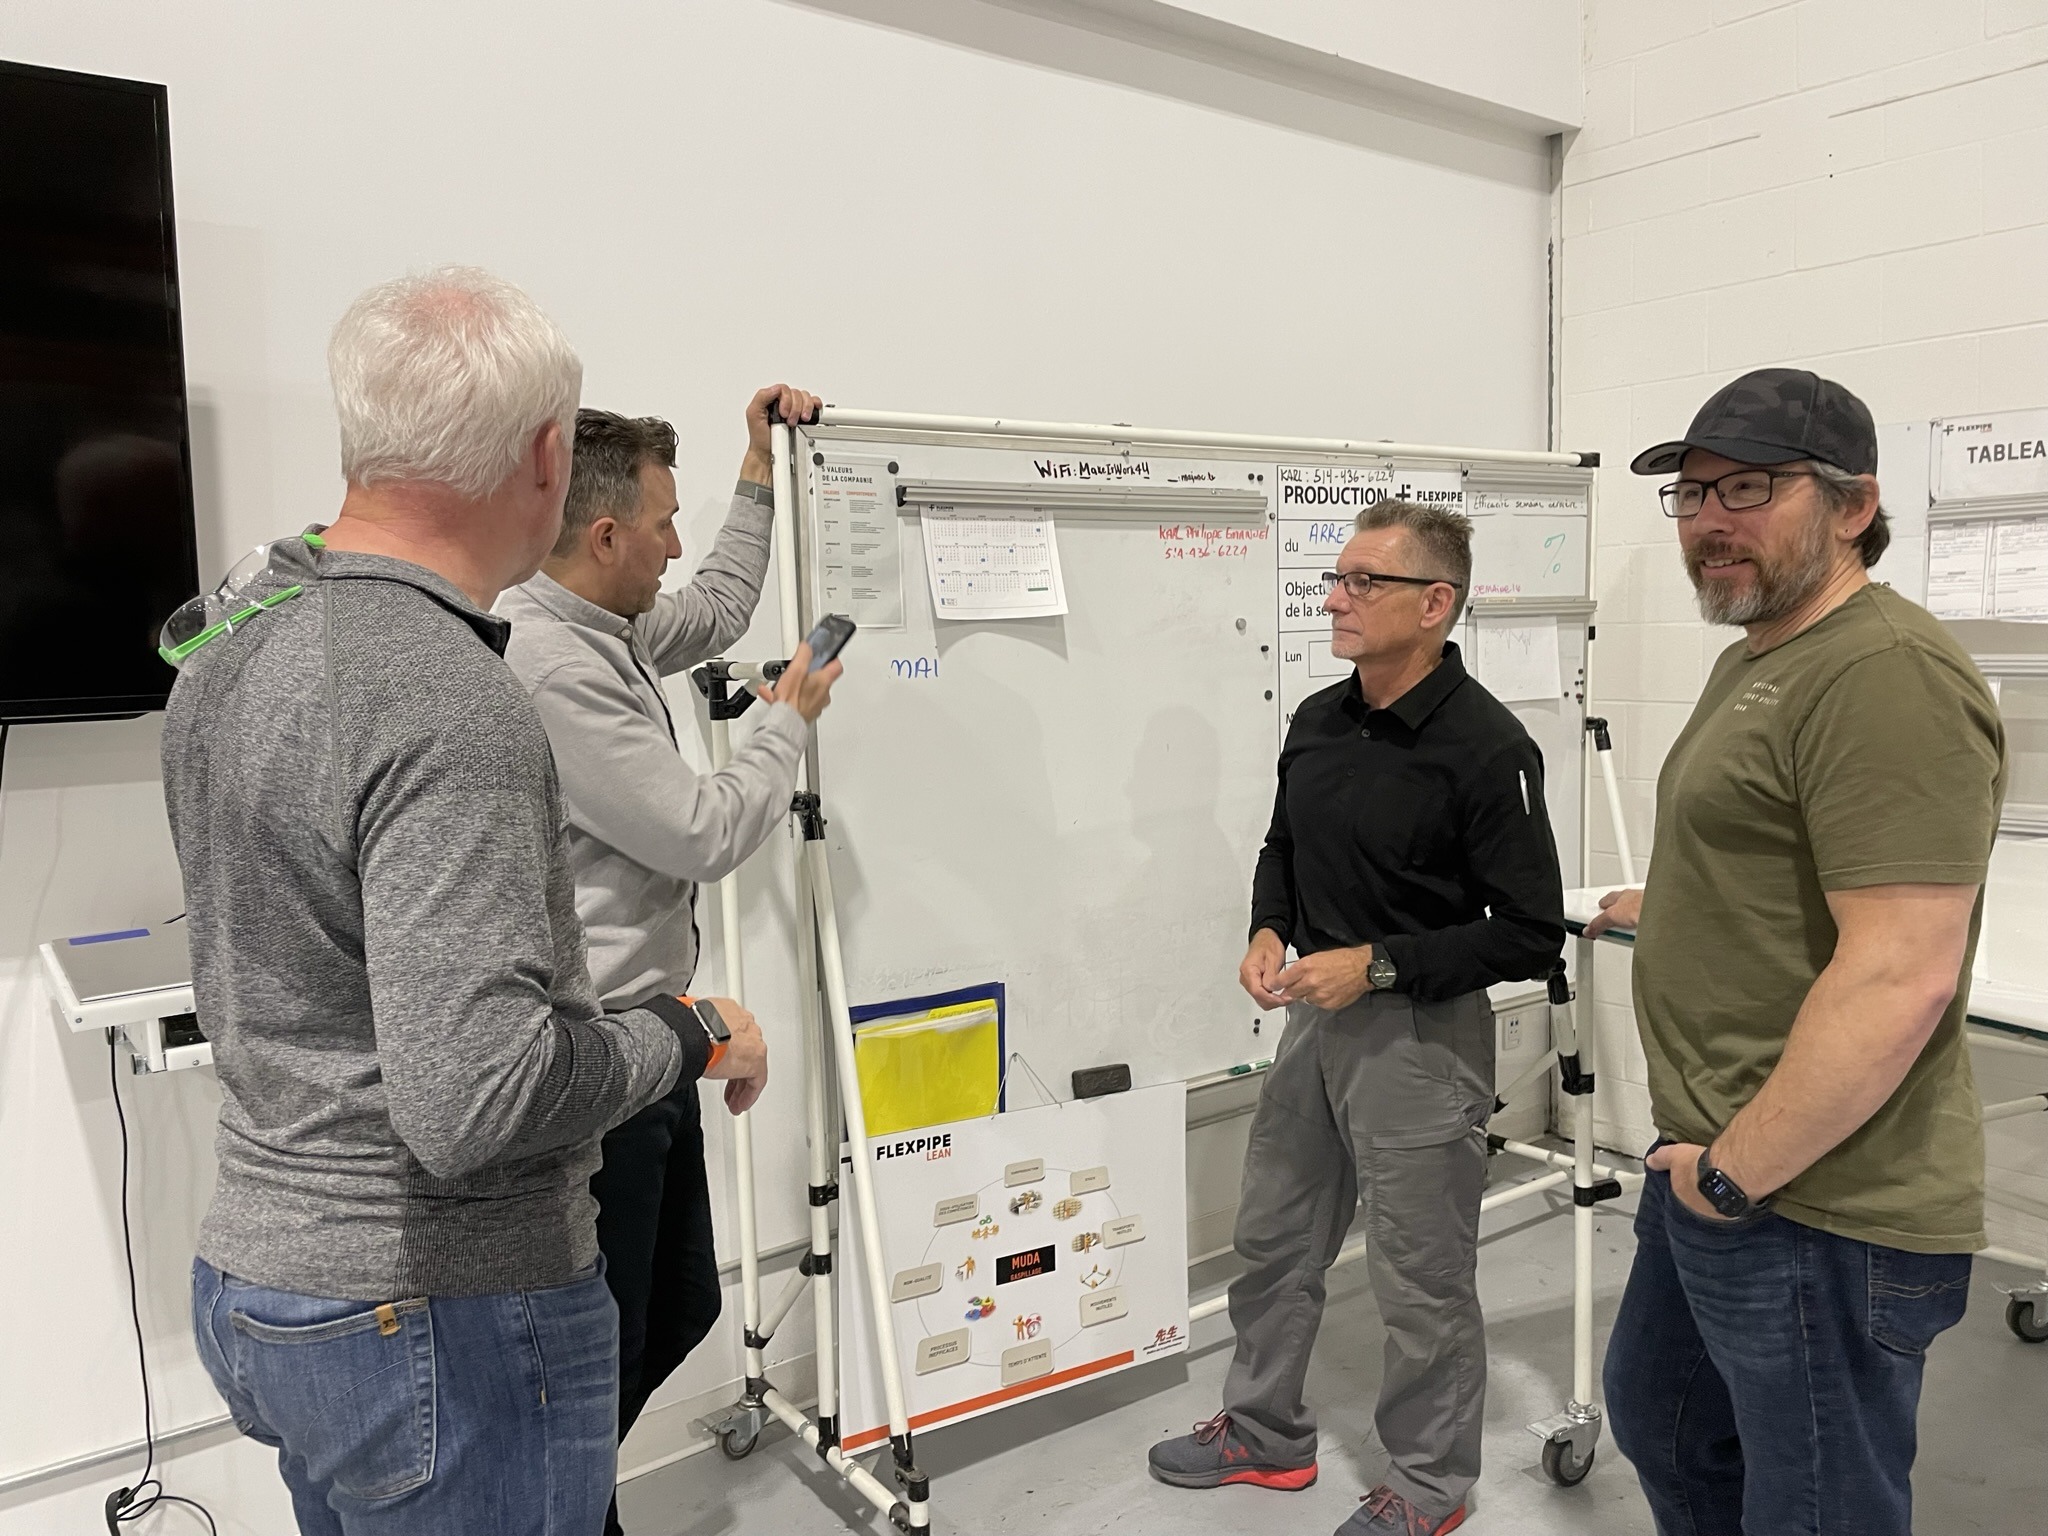
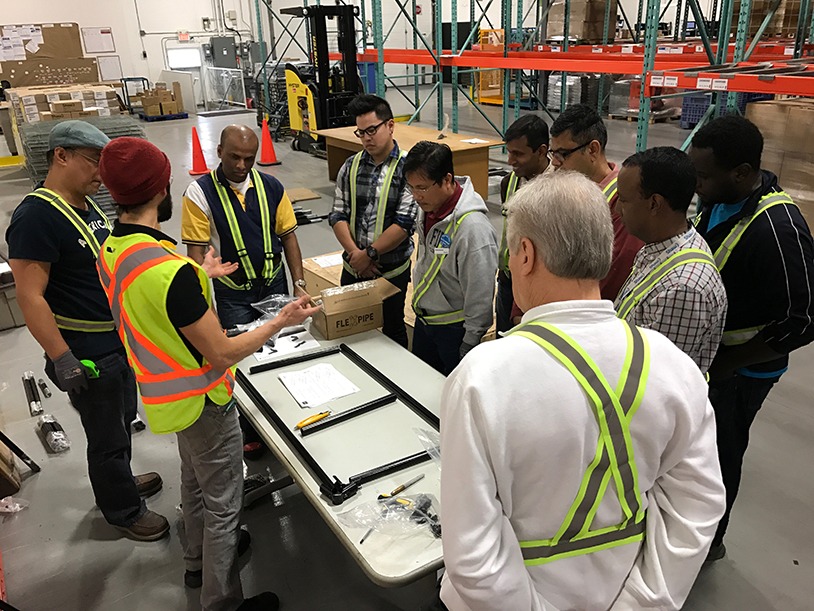
Learn more about the three fundamental principles needed to convince senior managers to pursue continuous improvement initiatives and how Flexpipe structures are critical to that goal with insight from Leslie Pickering and Mark Zeilinger of Quadrant 5.
In manufacturing environments, waste can take many forms. It can include work stoppages, human error, misaligned or out-of-tolerance parts, poorly assembled parts, machine downtime, redundant tasks, repetitive tasks, or any action or process that inhibits the natural flow of work.
Sometimes, reducing waste in manufacturing can be as simple as reducing the transit times to move work-in-process parts between cells. It could include revamping a workstation so that the assembly process is more seamless and the operator within the workstation has easier access to materials and tools.
Regardless of what approach is taken, these changes initially seem small. However, when repeated across all work cells, these small changes quickly add up until costs are reduced, quality is improved, and more finished goods are produced. Unfortunately, because these small steps seem so inconsequential, senior managers have difficulty viewing the benefits of adopting lean concepts.
As stated by Leslie, “Senior Managers are really good at developing global views – where they can see the end game or the end goal – but they often don’t take a sequential process to how those goals are achieved – what steps need to be taken sequentially to get there. Your job in continuous improvement is explaining the steps to achieve that goal.”
Ultimately, adopting continuous improvement initiatives can be summarized in three overriding steps. Leslie states, “1. This is what is currently happening. 2. This is what we’re trying to do, and 3. These will be the benefits of implementing lean.” So, does that mean you simply verbalize these issues to senior management, and they’ll quickly agree to pursue lean initiatives? No, it does not.

These three steps are merely guidelines. You must gather the hard facts that senior managers need to implement lean. Your goal includes gathering the data and defining the metrics that will help senior managers measure the return on investment (ROI) for enacting continuous improvement across the entire production floor.
All work operations or work tasks involved in making a product have a cycle time. Lowering cycle times means you’re manufacturing more products at a lower cost. The question senior managers want to be answered is whether the savings of implementing lean are higher than the cost of implementing lean.
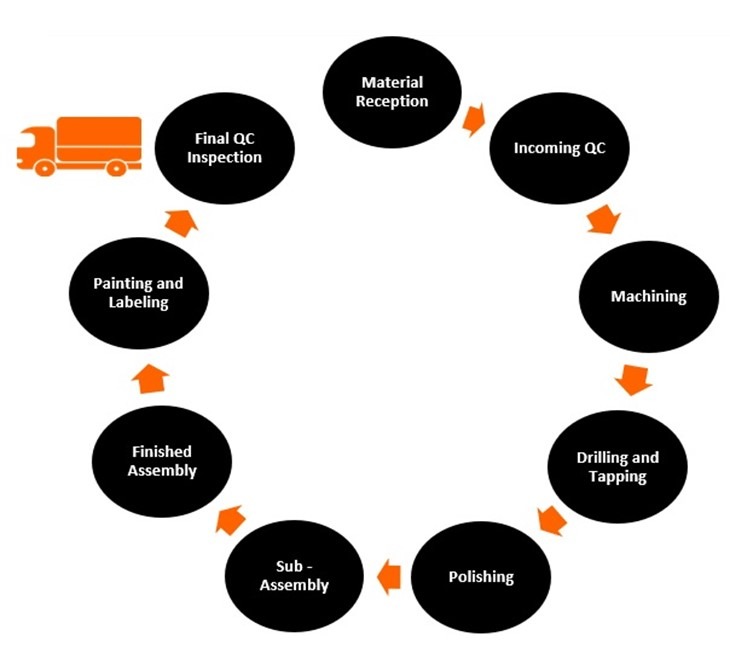
In our example, we’re using a basic cycle diagram (below) showing the steps for manufacturing a product. Our basic cycle diagram defines each work process or manufacturing step involved in making a fictitious product.
For the sake of simplicity, we’ll assume that each of these “steps” represents a single work cell. Each cell has a specific cycle time for a given work operation –the time it takes an operator to complete a work task.
Each cell also has a throughput volume – that volume of semi-finished parts the cell completes before those parts move to the next chain in the process.
This exercise aims to gather data on how lean initiatives can 1) Lower cycle times, 2) Increase throughput, 3) Lower manufacturing costs, and 4) Shorten the lead time to get finished goods to customers.
At the end of the exercise, you’ll have the data you need to show senior management what was happening, what you changed and why, and how making similar changes across all cells will result in lower cycle times, increased throughput, and reduced costs – or to paraphrase Leslie “the benefits of implementing lean.”
While operators might be paid for an 8-hour shift, they do not work a total of 8 hours. You must account for two 15-minute breaks in the morning and afternoon and then lunch. In our example, we’ll assume it’s a one-hour lunch. That leaves 6.5 hours of actual available work time.
Now, nobody can work at 100% efficiency. People go to the bathroom, get called away, or are interrupted for valid reasons. We’ll assume that the operator works at 85% efficiency. This means that the work time is 5 hours and 35 minutes.
We’ll now use that 5 hours and 35 minutes when calculating the work cell’s throughput.
Every lean process has a beginning, and we’ll assume that beginning includes you focusing on an initial assessment of a single work cell. Start by assessing the cycle times for each work task in your chosen work cell.
Ensure the operator or employee of the cell understands that your goal is to help make their job easier.
Make them feel part of the process, and they will be more than willing to show you some of the issues they come across.
Ensure they understand that this exercise is not about timing them but capturing the causes of work stoppages.
Mark of Q5, “We’re always touching on the human element. How do you get people engaged? That’s where improvements happen. Nobody knows that piece of equipment or machinery better than the operator themselves. So, you really need their input. The approach is to create “an island of excellence,” something people can point to as an example. So, give people recognition – a pat on the back and make them feel part of the continuous improvement process.”
| Operation | Work Cell #1 | ||||
| Unit of Measure | Cycle Time in Minutes converted to seconds | ||||
| Product | Widget X | ||||
| Set Up-Time Minutes | Conversion of Minutes to Seconds | Number of Work Operations | Cycle Time | Conversion of Minutes to Seconds | Comments / Notes |
| 30 | 1800 | 1 | 7,00 | 420,00 | Missing material (Operator had to search for material) |
| 2 | 8,00 | 480,00 | Missing assembly instruction
(Operator had to search for instructions) |
||
| 3 | 25,00 | 1500,00 | Broken SawBlade / No replacement (Operator had to leave work cell and go to stores to get replacement blade) | ||
| 4 | 5,00 | 300,00 | No issues – clean work task | ||
| 5 | 5,00 | 300,00 | No issues – clean work task | ||
| 6 | 8,50 | 510,00 | Missing assembly instruction
(Operator had to search for instructions) |
||
| 7 | 9,00 | 540,00 | Missing tool (lack of tool placement caused delay) | ||
| 8 | 5,00 | 300,00 | No issues – clean work task | ||
| 9 | 5,00 | 300,00 | No issues – clean work task | ||
| 10 | 15,00 | 900,00 | Missing tool (lack of tool placement caused delay) | ||
| Averages | 9,25 | 393,90 | |||
You’re going to create your own “island of excellence” by using these initial cycle times within the cell to show the issues the operator faces daily. You’ll also capture any reasons for delays or work stoppages.
In our example, the cycle times with no issues are done in five minutes or 300 seconds. We’ve converted it to seconds because even the smallest changes that save a couple of seconds can dramatically impact.
Now, the 5-minute cycle time may not be the optimized cycle time, but for this example, it’s the best cycle time this cell produces.
However, the average cycle time at the bottom is skewed by the operations (1,2,3,6,7, and 10) that encountered work stoppages. This means these work stoppages pushed the average cycle time to 9 minutes, 25 seconds, or 555 seconds.
There is no hard and fast rule about how many cycle times you should track. In our above example, we’ve tracked ten cycle times. We’ve converted those times from minutes to seconds to simplify how we calculate how much the work cell produces.
The table below summarizes the data you’ve gathered from the work cell. Now, it’s more than likely that you already know what a given work cell produces. You may also know what the cycle times are. Plenty of MRP and ERP software solutions provide cycle time data.
However, no software can show you how to reduce the cycle times. It can only report them. It can only provide numbers. You need to see for yourself what causes work stoppages. Only then can you enact strategies to reduce those cycle times and increase throughput.
| Operation | Average Cycle Time in Minutes | Average Cycle Time in Seconds | Total Number of Seconds (5 hours 5 minutes) | Work Cell Throughput | ||
| Work Cell #1 | 9,25 | 555,00 | 18300 | 33 | ||
You now have data on a work cell that defines Leslie’s first statement: “This is what is currently happening.” You have a list of the most common delays encountered by the operator in the work cell. You know the causes of higher cycle times and can enact strategies to eliminate those causes.
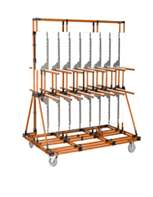
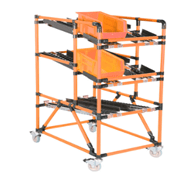
One of your changes included making a modular and scalable Flexpipe tool storage rack. You then placed this rack immediately outside the work cell, so the operator no longer has to walk to inventory to get replacement saw blades.
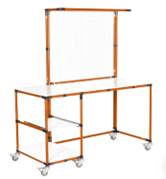
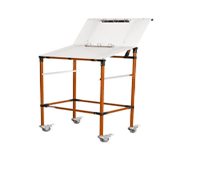
Another change included making a Flexpipe workstation where all tools and consumables are easily located. You combined this new workstation with a modular flow rack so that replacement consumables and materials are always readily available.
Finally, you’ve created a modular Flexpipe work center where the operator can easily access assembly instructions.
| Storage Rack: Machine Parts (Blades) | Modular Workstation | Modular Flow Rack | Modular Work Center with instructions |
 |
 |
 |
 |
After making these changes, you revisit the work cell and take a new set of cycle times.
While there are still operations that encounter some delays, the overall benefit is that you have achieved more operations that meet the desired cycle time.
| Operation | Work Cell #1 | ||||
| Unit of Measure | Cycle Time in Minutes converted to seconds | ||||
| Product | Widget X | ||||
| Set Up-Time Minutes | Conversion of Minutes to Seconds | Number of Work Operations | Cycle Time | Conversion of Minutes to Seconds | Comments / Notes |
| 30 | 1800 | 1 | 5,00 | 300,00 | No issues – clean work task |
| 2 | 7,00 | 420,00 | Misaligned part – small adjustment | ||
| 3 | 5,00 | 300,00 | No issues – clean work task | ||
| 4 | 5,00 | 300,00 | No issues – clean work task | ||
| 5 | 5,00 | 300,00 | No issues – clean work task | ||
| 6 | 7,35 | 441,00 | Replacement Tool needed – easily found – small delay | ||
| 7 | 7,30 | 438,00 | Replacement Tool needed – easily found – small delay | ||
| 8 | 5,00 | 300,00 | No issues – clean work task | ||
| 9 | 5,00 | 300,00 | No issues – clean work task | ||
| 10 | 14,00 | 840,00 | Broken Saw Blade – Replacement blade in material flow rack immediately outside work cell minimized replacement time. | ||
| Averages | 6,57 | 393,90 | |||
A new workstation made locating replacement tools easier for the operator.
Placing a storage rack for replacement saw blades immediately cut down on the time the operator took to replace the blade.
Instead of a 25-minute cycle time or “delay,” the operator merely located the replacement blade and made a change that only took 14 minutes.
Ultimately, your average cycle time was lowered to 6 minutes and 57 seconds.
The lower cycle times mean the work cell increased its throughput by 41%, from 33 to 46 units.
| Operation | Average Cycle Time in Minutes | Average Cycle Time in Seconds | Total Number of Seconds (5 hours 5 minutes) | Work Cell Throughput | ||
| Work Cell #1 | 6,57 | 393,90 | 18300 | 46 | ||
Increasing throughput in a work cell accomplishes nothing if the remaining work cells don’t make similar continuous improvement changes. All you’re doing is creating a backlog for the next cell in the process.
You’ve increased the cell’s throughput, but without making similar changes to the remaining work cells, it’s all for naught. At this point, you’ve gathered enough data to show how making small incremental changes can have a dramatic impact on a work cell’s throughput.
Senior managers often have little choice but to move forward on additional continuous improvement initiatives when presented with this data. It’s now very easy for them to see how repeating the process will lead to significant improvements and savings.
The costs of a Flexpipe structure include the cost of the materials and the time it takes your operators to assemble structures. That initial cost is minimal when compared to the constant returns of pursuing lean principles. The benefits of lean are forever.
As stated by Mark, “That’s what we love about Flexpipe. It’s really easy just to try something. There’s no downside whatsoever. Cut a pipe too short, and we’ll just use it elsewhere.”
Ultimately, the company would achieve the following benefits if you pursued similar continuous improvement initiatives with the remaining cells.
Flexpipe is a Montreal-based supplier, designer, and integrator of modular, scalable tube and joint systems for material handling. The company’s customer-centric focus and proactive approach empower manufacturers to make their structures at a fraction of the cost compared to fixed material handling systems.
The company’s free design extension for SketchUp is easy to use and provides a complete assembly drawing, material cost breakdown, and bill of materials.
If you would like to see how Flexpipe can help on your next continuous improvement project, contact us now.

Mr. Pickering holds a degree in Mechanical and Production Engineering. He brings 35 years of experience in international process improvement, manufacturing, and operations. He is a recognized Toyota Production System specialist and is highly regarded as a Subject Matter Expert in the areas of Lean Manufacturing.

Mr. Zeilinger holds a degree in Mechanical Engineering. He brings over 30 years of experience in manufacturing and operations. Mr. Zeilinger is a recognized Toyota Production System Specialist, who has implemented successful transformation methodologies across a wide variety of industries, including Packaging, Electronics, Construction, Plastics, Food, Automotive, and Aerospace.